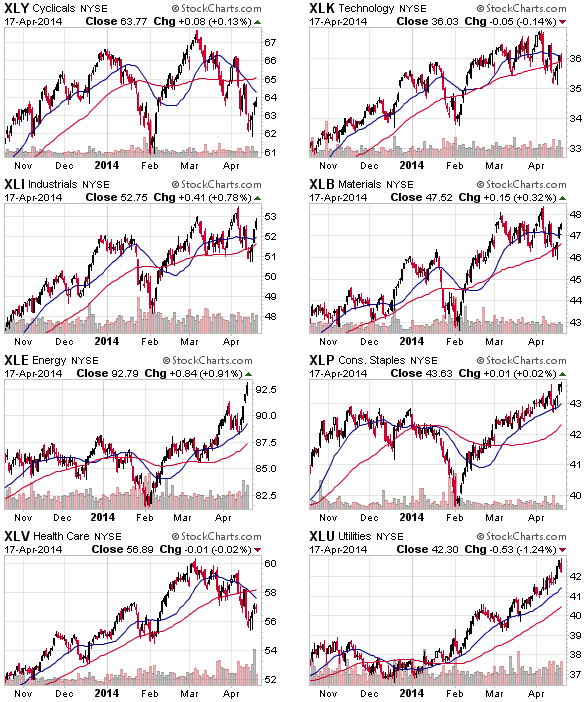
A bounceback week for the sector SPDRs heading in to the holiday:

So the table regains some green:
| Sector |
Symbol |
8 Wk % Chg |
4 Wk % Chg |
1 Wk % Chg |
YTD % Chg |
| Energy |
XLE |
+7.4% |
+6.6% |
+4.9% |
+4.9% |
| Consumer Staples |
XLP |
+4.9% |
+2.7% |
+2.1% |
+1.6% |
| Utilities |
XLU |
+4.3% |
+4.4% |
+1.5% |
+11.4% |
| Basic Materials |
XLB |
+2.9% |
+0.3% |
+3.2% |
+2.9% |
| Industrials |
XLI |
+2.6% |
+2.1% |
+3.6% |
+1.0% |
| Financials |
XLF |
+1.8% |
-2.4% |
+2.7% |
+0.1% |
| Technology |
XLK |
+0.2% |
-0.8% |
+2.4% |
+0.8% |
| Consumer Discretionary |
XLY |
-2.2% |
-2.9% |
+2.5% |
-4.6% |
| Health Care |
XLV |
-3.3% |
-2.2% |
+2.1% |
+2.6% |
Charts courtesy of StockCharts.com
