Market Wrap

Dow Industrials 16457.66 +134.60 +0.82%
S&P 500 1872.34 +14.72 +0.79%
Nasdaq Comp. 4198.99 +43.24 +1.04%
Russell 2000 1173.04 +21.23 +1.84%
NYSE Comp. 10527.79 +92.92 +0.89%
Nasdaq 100 3595.74 +24.25 +0.68%
Dow Transports 7574.96 +123.60 +1.66%
Dow Utilities 532.13 +5.19 +0.98%

View Major Index charts

Internals were positive on a little better volume. Advances/declines were 3 to 1 on both exchanges, with up/down volume near 7 to 2 on each. New highs/lows were 144/8 on the NYSE and 74/29 on the Nasdaq.

Leaders — Biotechs (+3.18%), Airlines (+2.62%), Transport (+2.49%), Broker Dealers (+1.99%), Defense (+1.79%), Disk Drives (+1.77%), Semis (+1.60%), Network (+1.58%)
Laggards — Gold/Silver (-2.31%), Oil (-0.04%), Oil Services (+0.07%), Natural Gas (+0.08%), Telecoms (+0.24%), Paper (+0.26%), Commodities (+0.35%), Retailers (+0.49%)

An extensive visual representation of the day’s winners and losers can be found at Finviz.com.

Treasury Yields — 6 Month: 0.05 %,  2 Year: 0.43 %,  5 Year: 1.72 %,  10 Year: 2.72 %,  30 Year: 3.56 %

Energy Prices — Crude oil: $101.52/barrel,  Gasoline: $2.92/gallon,  Natural Gas: $4.37/mmBTU

US Dollar Index — 80.095

Precious Metals — Gold: $1285.20/ounce,  Silver: $19.78/ounce,  Platinum: $1413.00/ounce

BMB Note:  
Thus ends the month of March and the first quarter of the year.

What’s Hot, What’s Not


Best Performing Industries
Last Week Last 4 Weeks Last 8 Weeks Year To Date
Oil ($XOI) +2.2% Telecom ($XTC) +3.5% Airlines ($XAL) +10.0% Airlines +11.2%
Oil Services ($OSX) +1.5% Banks ($BKX) +3.5% Oil Services +9.2% Gold & Silver ($XAU) +10.9%
Natural Gas ($XNG) +1.4% Oil Services +3.1% Semiconductors ($SOX) +9.1% Comp. Hardware ($HWI) +8.4%
Commodities ($CRX) +1.3% Steel ($DJUSST) +2.7% Oil +7.3% Semiconductors +7.9%
Utilities ($UTY) +1.2% Semiconductors +2.4% Chemicals ($DJUSCH) +7.1% Utilities +7.7%


Worst Performing Industries
Last Week Last 4 Weeks Last 8 Weeks Year To Date
Biotech ($BTK) -6.7% Biotech -10.9% Paper ($DJUSPP) -2.5% Steel -7.1%
Gold & Silver -5.2% Housing ($HGX) -6.9% Housing -1.8% Retail (XRT) -4.8%
Brokers ($XBD) -3.7% Gold & Silver -6.2% Biotech -1.2% Housing -3.0%
Disk Drives ($DDX) -3.2% Software ($GSO) -5.3% Software -0.1% Brokers -2.3%
Networking ($NWX) -2.8% Paper -5.1% Networking +0.4% Insurance ($INSR) -2.1%


Weekend Sector Scan

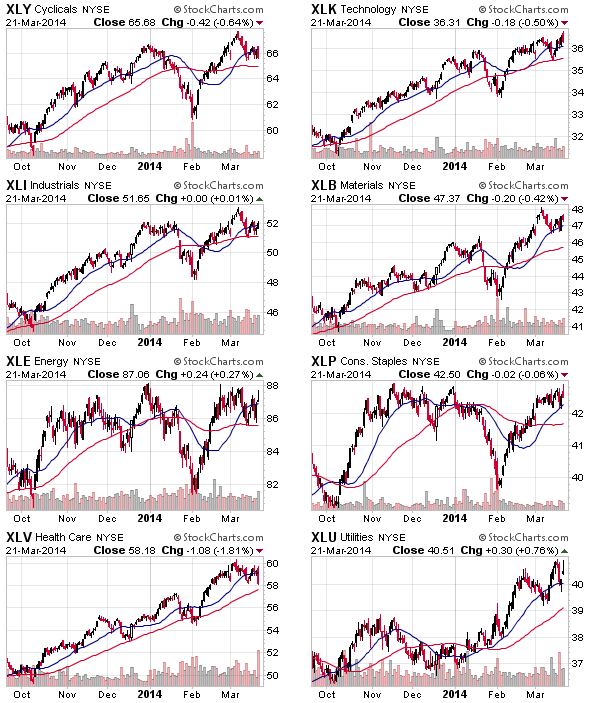
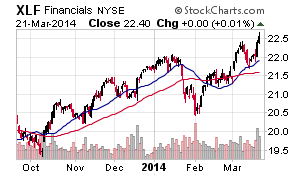
A split week for the sector SPDRs, with the Cyclicals/Discretionaries starting to sag, but Energy perking up:


The numbers as we close out the first quarter:


Sector Symbol 8 Wk % Chg 4 Wk % Chg 1 Wk % Chg YTD % Chg
Energy XLE +6.8% +1.6% +2.3% +0.7%
Basic Materials XLB +6.2% -0.7% -1.3% +1.3%
Financials XLF +5.0% +1.9% -1.3% +1.2%
Utilities XLU +4.9% +1.4% +1.2% +8.0%
Consumer Staples XLP +4.9% +0.9% +0.6% -0.5%
Technology XLK +3.6% -0.8% -0.7% +0.9%
Industrials XLI +3.4% -0.6% +0.2% -0.9%
Health Care XLV +3.1% -2.9% -0.8% +4.1%
Consumer Discretionary XLY +2.3% -3.8% -2.1% -3.8%


Charts courtesy of StockCharts.com

Market Wrap

Dow Industrials 16323.06 +58.83 +0.36%
S&P 500 1857.62 +8.58 +0.46%
Nasdaq Comp. 4155.76 +4.53 +0.11%
Russell 2000 1151.81 +0.37 +0.03%
NYSE Comp. 10434.87 +61.43 +0.59%
Nasdaq 100 3571.49 +8.35 +0.23%
Dow Transports 7451.36 +39.93 +0.54%
Dow Utilities 526.94 +1.06 +0.20%

View Major Index charts

Internals were positive on lighter volume. Advances/declines were 7 to 3 on the NYSE and just better than flat on the Nasdaq, with up/down volume 3 to 1 on the NYSE and 10 to 9 on the Nasdaq. New highs/lows were 77/13 on the NYSE and 35/40 on the Nasdaq.

Leaders — Homebuilders (+1.77%), Gold/Silver (+1.68%), Oil Services (+1.58%), Commodities (+1.23%), Oil (+1.16%), Retailers (+0.88%), Natural Gas (+0.76%), Semis (+0.73%)
Laggards — Biotechs (-2.84%), Disk Drives (-0.22%), Comp. Hardware (-0.16%), Insurance (-0.04%), Drugs (-0.01%), Network (+0.00%), Software (+0.07%), Utilities (+0.20%)

An extensive visual representation of the day’s winners and losers can be found at Finviz.com.

Treasury Yields — 6 Month: 0.05 %,  2 Year: 0.44 %,  5 Year: 1.73 %,  10 Year: 2.72 %,  30 Year: 3.55 %

Energy Prices — Crude oil: $101.59/barrel,  Gasoline: $2.93/gallon,  Natural Gas: $4.48/mmBTU

US Dollar Index — 80.173

Precious Metals — Gold: $1294.90/ounce,  Silver: $19.80/ounce,  Platinum: $1406.00/ounce

BMB Note:  

Market Wrap

Dow Industrials 16264.23 -4.76 -0.03%
S&P 500 1849.04 -3.52 -0.19%
Nasdaq Comp. 4151.23 -22.35 -0.54%
Russell 2000 1151.44 -4.04 -0.35%
NYSE Comp. 10373.53 +14.16 +0.14%
Nasdaq 100 3563.13 -19.75 -0.55%
Dow Transports 7411.43 -18.11 -0.24%
Dow Utilities 525.88 +3.88 +0.74%

View Major Index charts

Internals were mixed, with volume near yesterday’s levels. Advances/declines were 10 to 9 on the NYSE but 2 to 3 on the Nasdaq, with up/down volume 10 to 9 on the NYSE but 3 to 5 on the Nasdaq. New highs/lows were 50/29 on the NYSE and 20/51 on the Nasdaq.

Leaders — Natural Gas (+1.45%), Paper (+1.33%), Gold/Silver (+1.10%), Commodities (+0.90%), Oil Services (+0.86%), Telecoms (+0.83%), Utilities (+0.76%), Biotechs (+0.62%)
Laggards — Defense (-1.61%), Banks (-1.31%), Broker Dealers (-1.20%), Airlines (-1.07%), Transport (-1.03%), Semis (-0.78%), Chemicals (-0.78%), Comp. Tech (-0.66%)

An extensive visual representation of the day’s winners and losers can be found at Finviz.com.

Treasury Yields — 6 Month: 0.05 %,  2 Year: 0.41 %,  5 Year: 1.68 %,  10 Year: 2.68 %,  30 Year: 3.52 %

Energy Prices — Crude oil: $93.89/barrel,  Gasoline: $2.93/gallon,  Natural Gas: $4.55/mmBTU

US Dollar Index — 80.125

Precious Metals — Gold: $1292.70/ounce,  Silver: $19.70/ounce,  Platinum: $1394.00/ounce

BMB Note:  
Not real bad — but not real great either…

Market Wrap

Dow Industrials 16268.99 -98.89 -0.60%
S&P 500 1852.56 -13.06 -0.70%
Nasdaq Comp. 4173.58 -60.69 -1.43%
Russell 2000 1155.49 -22.56 -1.92%
NYSE Comp. 10360.18 -56.89 -0.55%
Nasdaq 100 3582.89 -46.84 -1.29%
Dow Transports 7429.54 -119.46 -1.58%
Dow Utilities 522.00 -2.53 -0.48%

View Major Index charts

Internals were negative on a little heavier volume. Advances/declines were 1 to 2 on the NYSE and 1 to 4 on the Nasdaq, with up/down volume 2 to 7 on the NYSE and 1 to 7 on the Nasdaq. New highs/lows were 92/29 on the NYSE and 55/35 on the Nasdaq.

Leaders — Drugs (-0.08%), Telecoms (-0.22%), Oil (-0.24%), Utilities (-0.45%), Natural Gas (-0.82%), Banks (-0.89%), Commodities (-0.90%), Oil Services (-0.93%)
Laggards — Gold/Silver (-3.92%), Metals (-2.75%), Paper (-2.37%), Disk Drives (-2.01%), Biotechs (-1.99%), Homebuilders (-1.76%), Software (-1.73%), Broker Dealers (-1.73%)

An extensive visual representation of the day’s winners and losers can be found at Finviz.com.

Treasury Yields — 6 Month: 0.05 %,  2 Year: 0.40 %,  5 Year: 1.67 %,  10 Year: 2.70 %,  30 Year: 3.55 %

Energy Prices — Crude oil: $92.74/barrel,  Gasoline: $2.85/gallon,  Natural Gas: $4.49/mmBTU

US Dollar Index — 79.965

Precious Metals — Gold: $1304.20/ounce,  Silver: $19.75/ounce,  Platinum: $1403.00/ounce

BMB Note:  
More ugly action.

Is the ice getting thinner? Feels like it…

Market Wrap

Dow Industrials 16367.88 +91.19 +0.56%
S&P 500 1865.62 +8.18 +0.44%
Nasdaq Comp. 4234.27 +7.88 +0.19%
Russell 2000 1178.05 -0.18 -0.02%
NYSE Comp. 10417.20 +55.13 +0.53%
Nasdaq 100 3629.73 +12.34 +0.34%
Dow Transports 7549.00 +38.62 +0.51%
Dow Utilities 524.53 +1.75 +0.33%

View Major Index charts

Internals were positive on lighter volume. Advances/declines were 7 to 5 on the NYSE and just better than flat on the Nasdaq, with up/down volume 3 to 2 on the NYSE and 10 to 9 on the Nasdaq. New highs/lows were 85/15 on the NYSE and 41/19 on the Nasdaq.

Leaders — Paper (+2.11%), Airlines (+1.64%), Comp. Hardware (+1.59%), Oil Services (+1.14%), Drugs (+1.08%), Disk Drives (+1.04%), Comp. Tech (+0.94%), Transport (+0.88%)
Laggards — Retailers (-1.03%), Broker Dealers (-0.57%), Telecoms (-0.32%), Software (-0.13%), Biotechs (-0.07%), Banks (+0.04%), Natural Gas (+0.19%), Insurance (+0.30%)

An extensive visual representation of the day’s winners and losers can be found at Finviz.com.

Treasury Yields — 6 Month: 0.06 %,  2 Year: 0.42 %,  5 Year: 1.72 %,  10 Year: 2.74 %,  30 Year: 3.58 %

Energy Prices — Crude oil: $99.24/barrel,  Gasoline: $2.88/gallon,  Natural Gas: $4.43/mmBTU

US Dollar Index — 79.950

Precious Metals — Gold: $1312.10/ounce,  Silver: $20.00/ounce,  Platinum: $1414.00/ounce

BMB Note:  
Quite a chopfest lately…

Market Wrap

Dow Industrials 16276.69 -26.08 -0.16%
S&P 500 1857.44 -9.08 -0.49%
Nasdaq Comp. 4226.38 -50.40 -1.18%
Russell 2000 1178.23 -15.50 -1.30%
NYSE Comp. 10365.41 -26.82 -0.26%
Nasdaq 100 3617.39 -35.68 -0.98%
Dow Transports 7510.38 -4.80 -0.06%
Dow Utilities 522.78 +1.12 +0.21%

View Major Index charts

Internals were negative, with volume lighter than Friday’s expiration. Advances/declines were 3 to 5 on the NYSE and 1 to 3 on the Nasdaq, with up/down volume 1 to 2 on the NYSE and 1 to 4 on the Nasdaq. New highs/lows were 65/19 on the NYSE and 43/35 on the Nasdaq.

Leaders — Airlines (+0.66%), Utilities (+0.24%), Telecoms (+0.23%), Insurance (+0.14%), Transport (+0.11%), Oil (+0.02%), Banks (-0.10%), Natural Gas (-0.16%)
Laggards — Gold/Silver (-4.66%), Biotechs (-2.42%), Network (-1.78%), Disk Drives (-1.44%), Comp. Hardware (-1.33%), Oil Services (-1.14%), Retailers (-0.98%), Drugs (-0.92%)

An extensive visual representation of the day’s winners and losers can be found at Finviz.com.

Treasury Yields — 6 Month: 0.06 %,  2 Year: 0.43 %,  5 Year: 1.73 %,  10 Year: 2.73 %,  30 Year: 3.57 %

Energy Prices — Crude oil: $99.36/barrel,  Gasoline: $2.89/gallon,  Natural Gas: $4.29/mmBTU

US Dollar Index — 79.920

Precious Metals — Gold: $1310.60/ounce,  Silver: $19.96/ounce,  Platinum: $1425.00/ounce

What’s Hot, What’s Not


Best Performing Industries
Last Week Last 4 Weeks Last 8 Weeks
Steel ($DJUSST) +6.3% Banks ($BKX) +7.1% Semiconductors ($SOX) +10.1%
Banks +4.5% Disk Drives ($DDX) +4.6% Chemicals ($DJUSCH) +9.9%
Oil Services ($OSX) +3.9% Retail (XRT) +4.6% Airlines ($XAL) +6.7%
Disk Drives +3.8% Oil Services +4.2% Oil Services +6.5%
Comp. Hardware ($HWI) +3.6% Chemicals +4.1% Utilities ($UTY) +6.3%


Worst Performing Industries
Last Week Last 4 Weeks Last 8 Weeks
Gold & Silver ($XAU) -7.2% Paper ($DJUSPP) -6.6% Natural Gas ($XNG) +1.1%
Biotech ($BTK) -1.8% Housing ($HGX) -4.8% Housing +1.7%
Housing -1.6% Gold & Silver -4.3% Paper +2.4%
Paper -0.5% Biotech -2.6% Transportation ($TRANQ) +2.4%
REITs ($DJR) -0.3% Software ($GSO) -2.1% Telecom ($XTC) +2.5%


Weekend Sector Scan

An up-and-down week for the sector SPDRs, but all are still near the highs:


The numbers as the Fed and expiration fade for now:


Sector Symbol 8 Wk % Chg 4 Wk % Chg 1 Wk % Chg YTD % Chg
Basic Materials XLB +8.0% +2.6% +1.0% +2.6%
Utilities XLU +6.7% -0.1% -0.9% +6.7%
Financials XLF +6.2% +4.3% +2.8% +2.6%
Health Care XLV +4.5% -1.1% -0.4% +4.9%
Industrials XLI +3.7% +0.5% +0.6% -1.1%
Consumer Discretionary XLY +3.4% +0.7% -0.3% -1.7%
Technology XLK +3.2% +1.0% +1.9% +1.5%
Energy XLE +3.2% +0.8% +0.8% -1.5%
Consumer Staples XLP +2.6% +2.2% -0.2% -1.0%


Charts courtesy of StockCharts.com